
| Wind Watch is a registered educational charity, founded in 2005. |
Germany’s power mix
Author: | Emissions, Germany, Grid
Translate: FROM English | TO English
Translate: FROM English | TO English
The following graphs show: 1) Installed net power generation capacity in Germany 2002–2016; 2) Gross power production in Germany 1990–2015 by source; and 3) German power import/export 1990–2015.
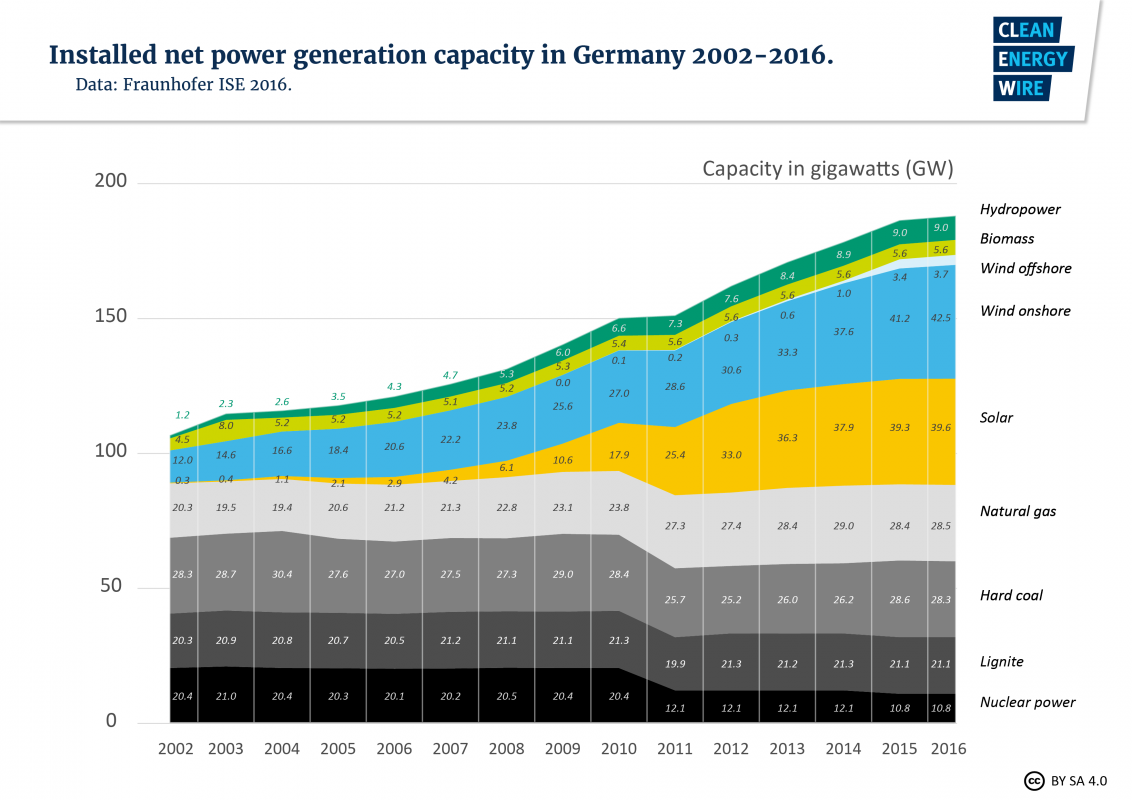
Note that since 2011, the capacity of nonrenewable sources has not decreased. The slight decrease in nuclear was made up for by an increase in coal.
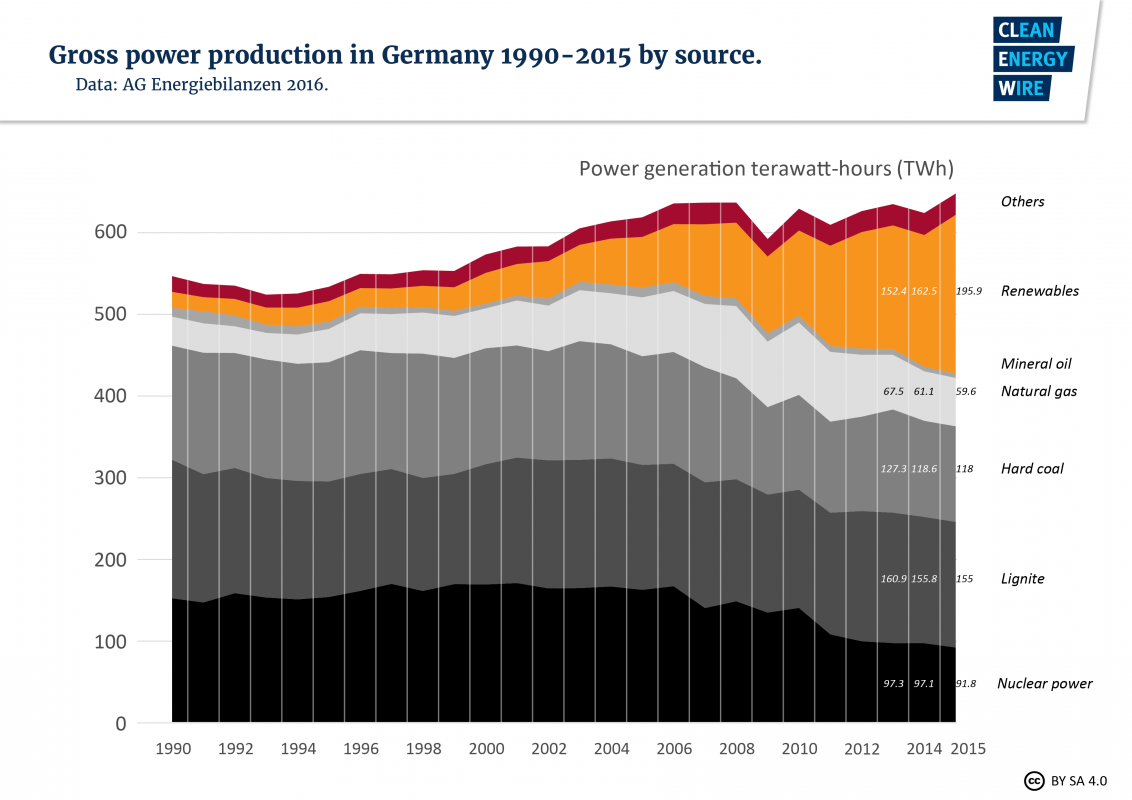
Electricity production from coal and natural gas has hardly decreased, even with the substantial increase of production from renewables.
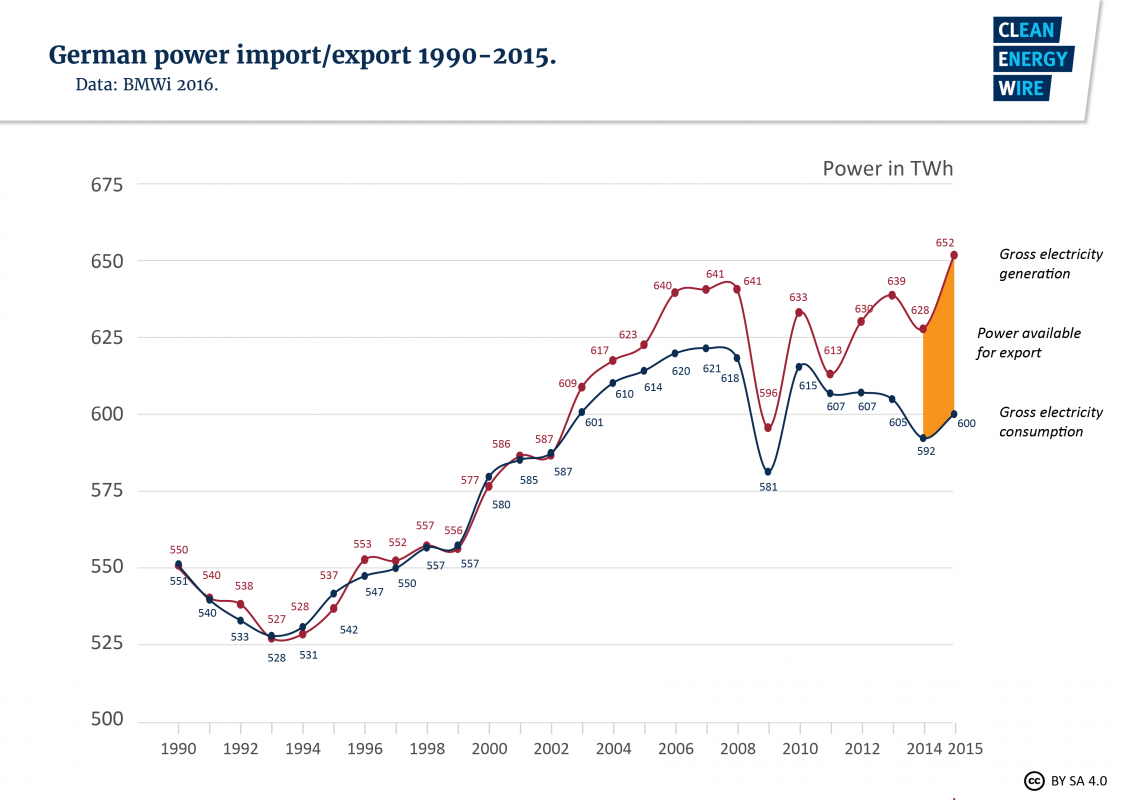
Since 2002, when the share of electricity production from renewables approached 10%, overproduction steadily increased. In other words, electricity production from renewables – which does not follow actual demand and in the case of wind is highly variable – was mostly exported into the larger regional grid when it could no longer be absorbed by the domestic grid.
This material is the work of the author(s) indicated. Any opinions expressed in it are not necessarily those of National Wind Watch.
The copyright of this material resides with the author(s). As part of its noncommercial educational effort to present the environmental, social, scientific, and economic issues of large-scale wind power development to a global audience seeking such information, National Wind Watch endeavors to observe “fair use” as provided for in section 107 of U.S. Copyright Law and similar “fair dealing” provisions of the copyright laws of other nations. Queries e-mail.
| Wind Watch relies entirely on User Funding |
 (via Stripe) |
 (via Paypal) |
Share:
![]()
![]()
![]()
![]()
![]()
![]()
![]()
![]()
![]()
![]()
![]() [ Short URLs: https://wind-watch.org/doc/?p=4607 | http://wndfo.net/D4607 ]
[ Short URLs: https://wind-watch.org/doc/?p=4607 | http://wndfo.net/D4607 ]
Tags: Wind power, Wind energy
