
| Wind Watch is a registered educational charity, founded in 2005. |
Impact of bad choices for climate change mitigation
Author: | Economics, Emissions, Grid, Health, Law, Ontario
Translate: FROM English | TO English
Translate: FROM English | TO English
Presented at: 3rd Climate Change Technology Conference, May 27-29, 2013, Concordia University, Montreal, Quebec
This presentation will show the necessity to research beyond the simplistic impressions that are too often used to justify major public policy decisions when selecting choices. We will see that what may seem to be an obvious choice can actually have produce the wrong results. Instead of aiding the environment, the wrong choice can hurt the environment, and the public.
Bad choices do have adverse impacts.
There is probably general agreement in this room that wastage of any resources is not wise.
However, we must acknowledge that civilization requires energy to progress. Reducing energy consumption to zero may not be advisable, if it takes us back to cooking with fires and lighting with whale oil. We need to look at the impact of the choices we make.
An Ontario Power Authority was put in place to plan the future energy decisions for the province. Then, from May 2005 to February 2013, the Ontario Minister of Energy issued at least 65 “directives” to the OPA, telling it what decisions it was to make, tying its hands to make decisions by science – instead directives were often driven by ideology rather than careful thought, and the consequences were not always what was desired.
As examples, directives called to bring into service 10,800 MW of “new” renewable electrical generation by 2015. Mostly this would be wind generation. The Green Energy Act took away local planning, authority, and reduced normal business case evaluations.
The Ontario Auditor General noted in his annual review in 2011 that the directives had a number of undesired results, including these and rate increases.
Some of the directives failed to understand the basic principles of electrical generation. It was assumed that generation could be added to the system anywhere, and then users could draw from the system anywhere, as if the system was just a big bathtub. In reality it is more like a tub filled with sponges, that introduce time delays and losses.
Truth is, if generation travels long distances from the source to the consumer there will be little left, and stability issues become pronounced as transmission lines get longer.
Ideally generation wants to be located near the user – which in Ontario means close to the GTA, and yet, even while there is a major generating site at Pickering, the directives continue to predict that remote, intermittent wind and solar from as far as James Bay will replace Pickering.
It’s not that easy!
To select the best choices, we need to look at the electrical system.
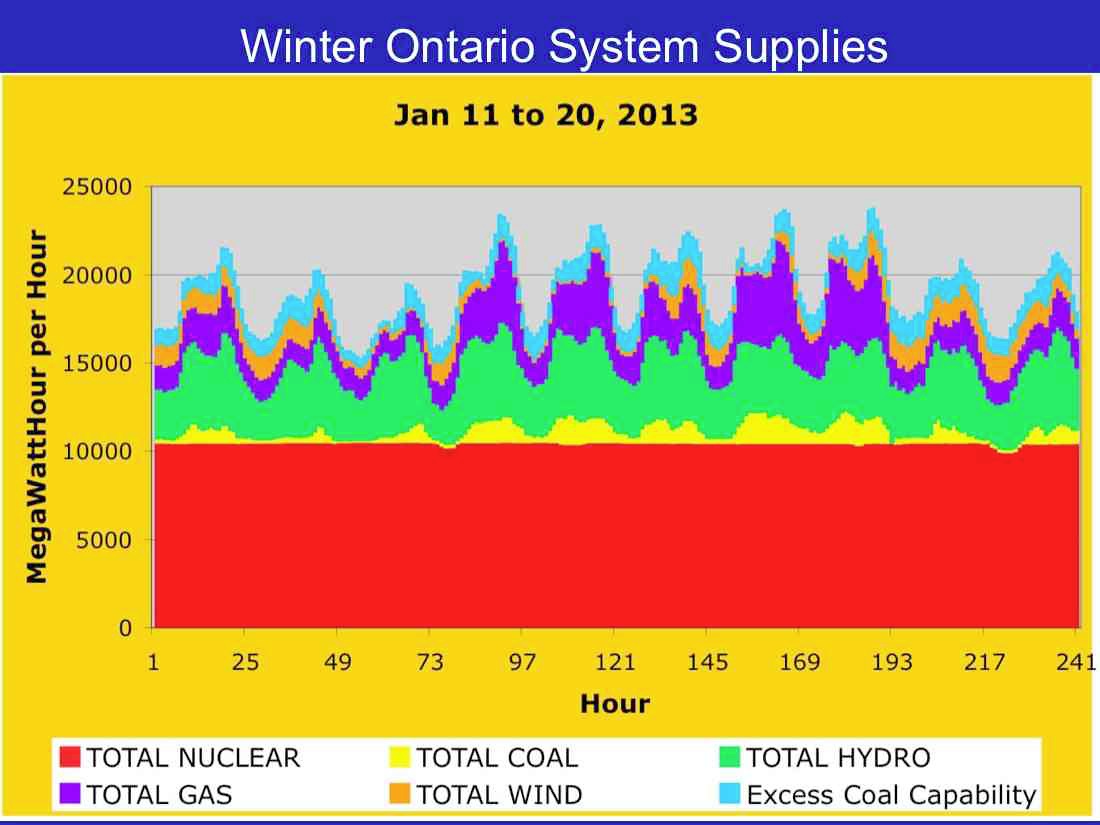
Here is the Ontario electrical system from the data of the Independent Electrical System Operator (IESO) for a week in January. You can see that over 66% of the base (night time) load comes from continuously operating nuclear generators (red), supplying about 10,000 MW. Hydro (green) supplies some of the rest of the base load, with some contribution from gas fired generation (purple). Day time increases to peak loads were met by increases in hydro, gas, and coal (yellow).
The wind generation in Ontario (orange), with a nameplate capability of about 1720 MW supplied very little when the demand was highest. Yet, wind supplied best when the demand was lowest. This is not a coincidence, it is the nature of wind. Demand is highest in the winter when high pressure brings cold crisp weather, and then demand is lowest on mild days when the wind is blowing. You will also see that this winter, the system operators were maintaining a surplus of coal generation on the system about equal to the amount of wind generation to have a buffer for when the wind dropped – which it does.
You will even see that the day when wind was highest in output, the system demand was lowest, and what happened was that nuclear and wind output was reduced, even while some gas generation stayed on line.
If we look now at a spring week, the first thing to note is that the overall system demand is considerably lower … and with less day to night variation.

Wind is now a bit steadier, and you see that routinely excess generation results in reduction of nuclear and hydro generation.
These too have consequences, as we will see on the next slides.
Here are the charts for the 4 nuclear generators at Bruce B, for the months of October through December 2012. You can see how often these units were derated from nominally 800 MW to about 550 MW due to excess generation – mostly from wind. Each orange spike is an overnight generation reduction.

Each one of these spikes means that steam is diverted from the steam turbine to be dumped to the condenser. Each spike means a diversion of some 300 kg/sec of steam at 4100 kPA and 250 degrees C. There is very little actual reduction in reactor power, as the reactors must stay at high power. The energy is just wasted – with an unnecessary stress put on the plant each time. Yes, they have the capability to do this, but it is not desirable operation – simply because of a directive that says buy all the available wind.
It is not good planning, it is not minimizing risk, and it is certainly not minimizing cost. In short it is a result of adapting to a bad policy directive.
Let’s summarize – we might buy 1720 MW of wind at $135 per MWh. It already forces us to derate hydro and nuclear.
Derating hydro means OPG is paid less and has less funds to do maintenance.
Derating Bruce Nuclear accommodates the excess generation, but needs to be paid some $52 a MWh for the energy as the reactors stay at high power. If a reactor is shut down it is not available to return to power for some 40 hours.
So, consumers pay $135 per MWh for wind, whether needed or not, plus for most wind generators an additional $10 a MWh federal EcoEnergy grant. Then consumers pay Bruce $52 a MWh to dump steam.
When there is still an excess consumers pay other utilities to take the excess.
The consumer pays over $350 a MWh for energy that is not even needed.
Does it help to make the consumer pay 3× for unneeded power? Is this conservation?
When the Ontario Minister of Energy announced the Green Energy and Environment Act in 2006, he predicted it would result in an electricity price increase of about 1% a year. Yet the actual prices have increased from 30% to 80% in 6 years, and the costs are increasing even faster now as more new transmission lines to handle intermittent wind come into service.
And Ontario has directives to progress from 1720 MW of wind now to some 8400 MW by 2015 and eventually to 10,800 MW – and maybe more.
As the consumer pays more, they have less flexibility to make wise choices. Manufacturing has a harder time to pay energy bills. It is not a coincidence that Xstrada moved its electricity consuming smelting operation from Ontario to Quebec, or that Caterpillar moved jobs out of Ontario, or Stony Creek Dairy moved out of Ontario … or that more jobs are being lost. How long will Ontario have an automotive industry when suppliers have plants in the USA with energy costs half of Ontario’s?
The decisions are not aiding climate change mitigation, they are only driving the effects elsewhere.
Let’s look at 4 years in January of system demand (in blue) and wind output (scaled from 0 to 100%) in red.

You can see that wind has the nature to be available when the system demand is low, and then drop rapidly as the system demand rises. Wind also routinely is of low availability for days on end when the system demand is highest. Storage for days is not what is talked about by the street corner battery banks – they are talking of perhaps 15 minutes of storage. Converting wind energy to hydrogen and then burning hydrogen (in fuel cells or generators) will increase the costs by several orders of magnitude again.
If we look at 4 years of July wind versus system data, we find that in the second time of the year when the system demand peaks, the summer. Wind does even more poorly. The overall wind system performance in the summer is in the order of 10 to 15% on average, and it is often less than 10% for days on end. Seasonal storage from spring to summer would be even greater as we convert wind energy to hydrogen and store it in caverns.

It’s not good for the environment to have to overbuild the system to accommodate the variations of intermittent supply. …
Let’s look at the actual data from the IESO and predecessor organizations of Ontario Power Generation and Ontario Hydro.

You can see Darlington Nuclear Generating Station coming on line in the early 1990’s (purple) resulting in fossil fuel (black) dropping in output.
Then, as costs increased, the government changed and took initiatives to reduce costs – laying off senior Ontario Hydro staff, and reducing maintenance. Output dropped in the nuclear generators. A decision was made to layup the Pickering A and Bruce a generators to restore the newer plants to higher performance. Coal output went up.
Then as the nuclear units started to come back on line in 2003, coal started to drop again. In 2006, with the recession, the demand decreased, and coal dropped further. New (higher cost) natural gas generators lowered the coal demand further … it certainly was not the 4 TWh of wind that reduced coal from 40 TWh a year to under 4 TWh.
The other argument heard was that bringing on stream new renewables in wind and solar would improve health.
If we look at the unbiased data from the Institute for Clinical Evaluative services (ICES) we find that from the early 1990’s even as coal output increased, then decreased (black line), the Asthma Incidence Rate for infants (yellow line) continued to decrease.

Looking at the incidence rates for older children it can be seen that the peak in infant asthma rate in the early 1990’s moved through the older age groups and is now decreasing in all groups … but the link to coal is tenuous at best.
Perhaps the decrease in infant asthma is more closely linked to parents not smoking in front of children?
It certainly did not reduce due to wind turbines. …
Download original document: “Impact of bad choices for climate change mitigation”
This material is the work of the author(s) indicated. Any opinions expressed in it are not necessarily those of National Wind Watch.
The copyright of this material resides with the author(s). As part of its noncommercial educational effort to present the environmental, social, scientific, and economic issues of large-scale wind power development to a global audience seeking such information, National Wind Watch endeavors to observe “fair use” as provided for in section 107 of U.S. Copyright Law and similar “fair dealing” provisions of the copyright laws of other nations. Queries e-mail.
| Wind Watch relies entirely on User Funding |
 (via Paypal) |
 (via Stripe) |
Share:
![]()
![]()
![]()
![]()
![]()
![]()
![]()
![]()
![]()
![]()
![]() [ Short URLs: https://wind-watch.org/doc/?p=3438 | http://wndfo.net/D3438 ]
[ Short URLs: https://wind-watch.org/doc/?p=3438 | http://wndfo.net/D3438 ]
Tags: Wind power, Wind energy
